Translate this page into:
Ocular blood flow in normal tension glaucoma and primary open angle glaucoma

-
Received: ,
Accepted: ,
How to cite this article: Kundan S, Joseph R, Shetty J, Ballal S. Ocular blood flow in normal tension glaucoma and primary open angle glaucoma. IHOPE J Ophthalmol 2023;2:77-82.
Abstract
Objectives:
The purpose of the study was to study the ocular blood flow (OBF) in primary open-angle glaucoma (POAG) and normal-tension glaucoma (NTG) by color Doppler imaging (CDI) in the ophthalmic artery (OA), central retinal artery (CRA), and posterior ciliary artery (PCA) and to correlate this with structural and functional damage in glaucoma.
Materials and Methods:
This was a cross-sectional and observational study. This was a cross-sectional study, in which 30 eyes of each group and controls were studied, CDI was done by a single observer for all cases. Peak systolic velocity (PSV), end-diastolic velocity (EDV), and resistive index (RI) were calculated for OA, CRA, and PCA. Visual fields and retinal nerve fiber layer (RNFL) analysis were done.
Results:
PSVs and EDVs were lower and RIs were higher for CRA and PCA of NTG and POAG compared to those of controls. The severity of glaucoma (visual field defect) increased when RI of OA was increased in NTG. No such relationship was established between RNFL thinning and OBF.
Conclusion:
Reduction in PSV and EDV leads to increased RI which is one of the contributory factors in the functional damage in NTG.
Keywords
Ocular blood flow
Normal-tension glaucoma
Primary open-angle glaucoma

INTRODUCTION
Elevated intraocular pressure (IOP) is a significant, controllable risk factor for open-angle glaucoma.[1] Glaucoma has been linked to a number of risk factors, including low ocular blood flow (OBF), oxidative stress, decreased axoplasmic flow, and heredity. Numerous epidemiological studies have suggested that OBF may be a risk factor for the development of glaucoma.[2]
For sustaining healthy eyes, nutrients, and oxygen are essential. Local blood vessel resistance, which can alter quickly in response to shifts in ocular demand, controls blood flow to the eye. Under typical conditions, the connection between eye blood flow and perfusion pressure is self-regulated. Autoregulation aids in maintaining blood flow at a relatively constant level despite variations in metabolic demands and ocular perfusion pressure. Changes in the ocular perfusion pressure cause diseases such as glaucoma and diabetic retinopathy to advance.
Numerous techniques exist for measuring OBF. In the ophthalmic artery (OA), central retinal artery (CRA), and posterior ciliary artery (PCA), color Doppler imaging[3] (CDI) is a non-invasive technique for assessing blood flow and vascular resistance in primary open-angle glaucoma (POAG) and normal-tension glaucoma (NTG) patients. The purpose of our research is to determine if there is any correlation between OBF and structural and functional glaucoma damage.
MATERIALS AND METHODS
This was a cross-sectional and observational study. Thirty eyes of each NTG, POAG, and control were taken over 2 years. There was no statistically significant difference between these three groups of patients in age, systolic and diastolic blood pressure (SBP and DBP), duration of hypertension, and other systemic parameters. Coronary artery disease and carotid artery stenosis patients were not included in our study.
Using a Voluson GE E8 with a 9L-D probe, eye blood flow was analyzed. A single observer performed CDI on all patients while they were lying supine with their eyes closed. In OA, CRA, and PCA, we estimated peak systolic velocity (PSV), end-diastolic velocity (EDV), and resistive index (RI). Ocular CDI used the same transducer and acoustic gel as a standard color Doppler examination. Images of the orbital anatomy were taken for each patient. In real-time scanning, we took into account both the axial and the sagittal planes.
The eyelids were coated with sterile coupling gel, and the examination was performed with a 9MHz probe utilizing the Baxter et al. approach, which avoids the use of excessive physical pressure on the probe.[4,5]
Doppler frequency changes from a certain sample volume are used to visualize these individual vessels. When the vessel of interest is positioned over this sample volume, a spectral waveform is built from the frequency shifts that have been detected. The time-velocity wave shape of this spectral wave displays the cumulative frequency shifts.
It is possible to detect systolic and diastolic velocities in a single sample volume because the velocities in the sample follow the heart cycle.
PSV (cm/s), EDV (cm/s), and RI were the primary focus of measurements of the CRA, PCA, and OA spectra.
RI is a parameter ranging in value between 0 and 1.
0 representing completely non-pulsatile flow (EDV=PSV)
1 representing purely pulsatile flow (absent EDV)
The carotid artery was analyzed to rule out any stenosis and plaques.
Single Doppler readings were taken of CRA, PCA, and OA from which RI was calculated [Figure 1].
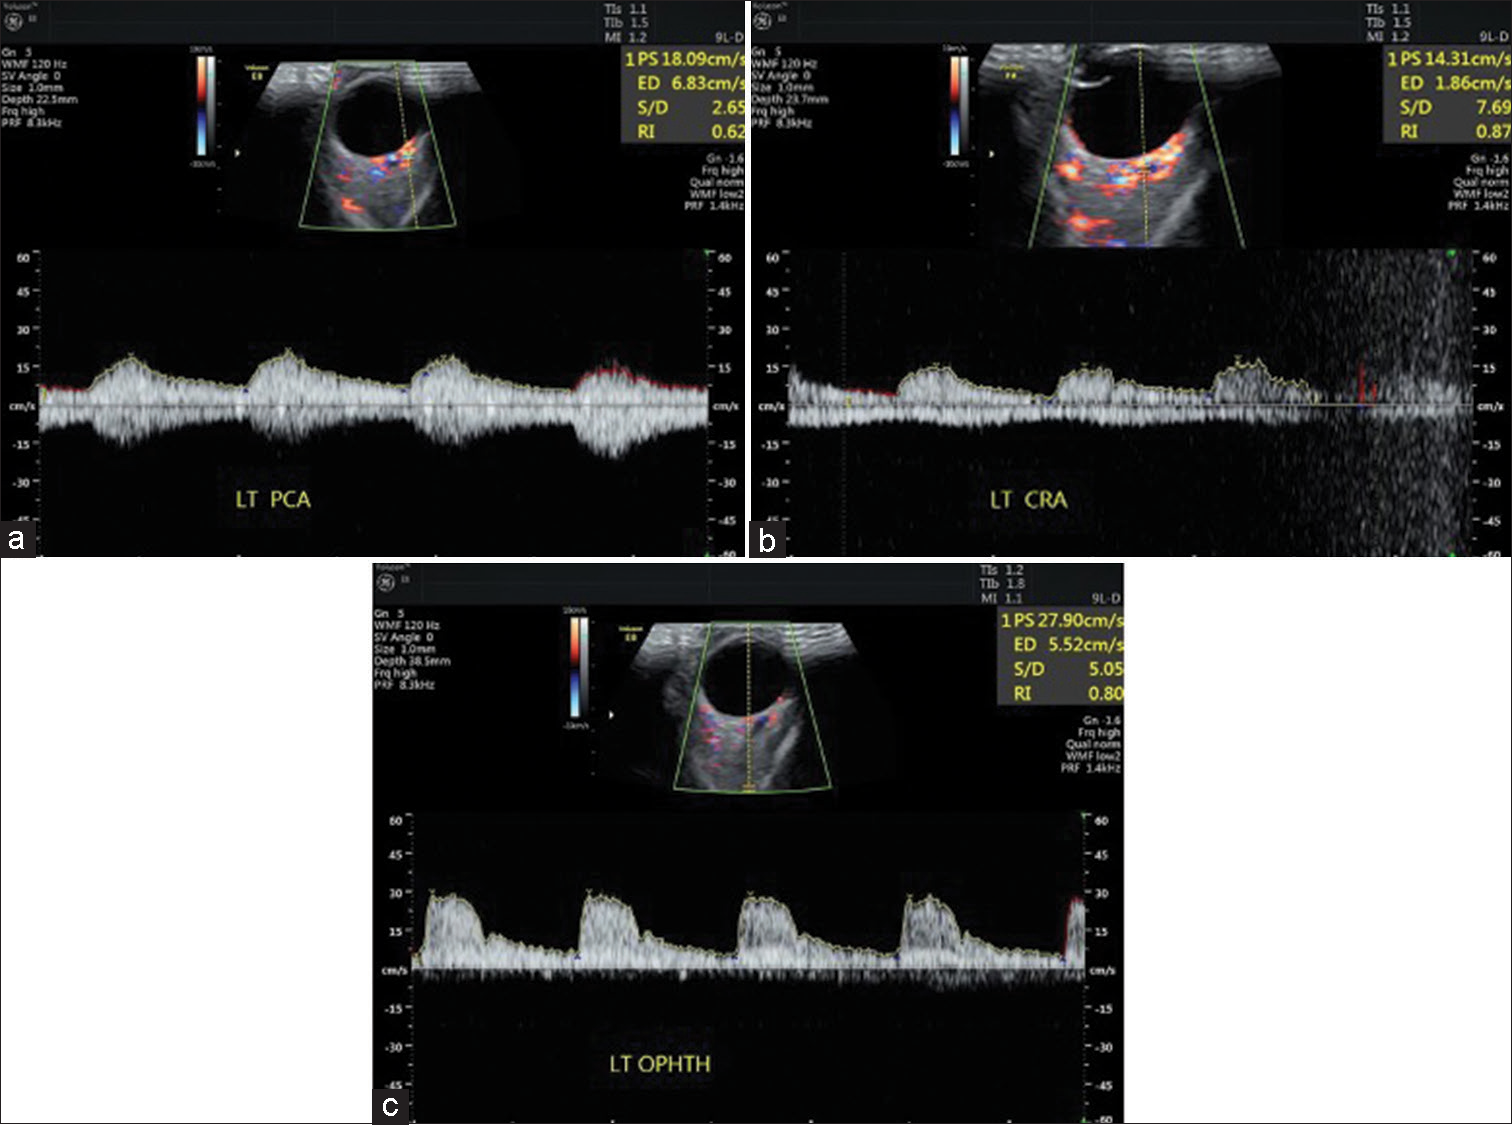
- (a-c) Color Doppler imaging of patient showing peak systolic velocity, end-diastolic velocity, and RI in the posterior ciliary artery, central retinal artery, and ophthalmic artery. PS: Peak systolic velocity, ED: End diastolic velocity, S/D: Average systolic velocity/average diastolic velocity, RI: Resistive index. LT PCA: Left posterior ciliary artery, LT CRA: Left central artery, LT OPHTH: Left ophthalmic artery (these are values of ocular blood flow of left eye of patient).
Inclusion criteria
Newly diagnosed cases of POAG and NTG not on anti-glaucoma medications were included in the study.
Exclusion criteria
Patients with secondary open-angle glaucoma, angle-closure glaucoma, carotid artery stenosis, diabetic retinopathy, central retinal vein occlusion, branch retinal vein occlusion, arterial occlusions, and post-trabeculectomy patients were excluded from the study and those who have had previous retinal surgery and penetrating keratoplasty. Hypertensive patients receiving calcium channel blockers and beta-blockers were also excluded.
RESULTS
All data were captured using the pro forma. Data was then transcribed into Microsoft Excel. Statistical analysis was done using the software Statistical Package for the Social Sciences (SPSS) 23.0 version. All categorical variables were expressed as frequency and percentages. Continuous variables were presented by mean ± standard deviation. Student t-test was used to test the significant difference between the two means. A one-way analysis of variance was used to test the significant difference between the three means. The Chi-square test was used to test the association between categorical variables. P < 0.05 was statistically significant.
Most of the patients in our study were in the age group of 50–88 years. There was equal gender distribution in POAG and male predominance in NTG in our study group.
Mean IOP in control was found to be 10.87 ± 2.20 mmHg, 13.78 ± 2.15 mmHg in NTG, and 28.11 ± 5.01 mmHg in POAG.
Average RNFL thickness on spectral domain optical coherence tomography (SD-OCT) was found to be lowest in POAG at 68.27 ± 11.75 µm and 69.70 ± 15.36 µm in NTG. The average RNFL thickness on SD-OCT in controls was 89.13 ± 6.50 microns.
About 40% of NTG cases showed moderate visual field defects and the rest 60% showed early visual fields defect in 30-2 Visual field analyzer (VFA). About 40% of POAG cases showed severe visual field defects, 53.3% showed moderate visual field defects, and the rest 6.6% showed early visual field defects in 30-2 VFA (Nothing was done to correct the severity of glaucoma).
Normal RI <0.7[6] and RI >0.85 are associated with increased vascular resistance and decreased end-organ perfusion.
The resistive index was found to be highest in the NTG group of patients for all three arteries (CRA, PCA, and OA) compared to POAG and controls. Resistive indices in all three arteries were found to be statistically significant (P < 0.05) [Figures 2,3 and Table 1].
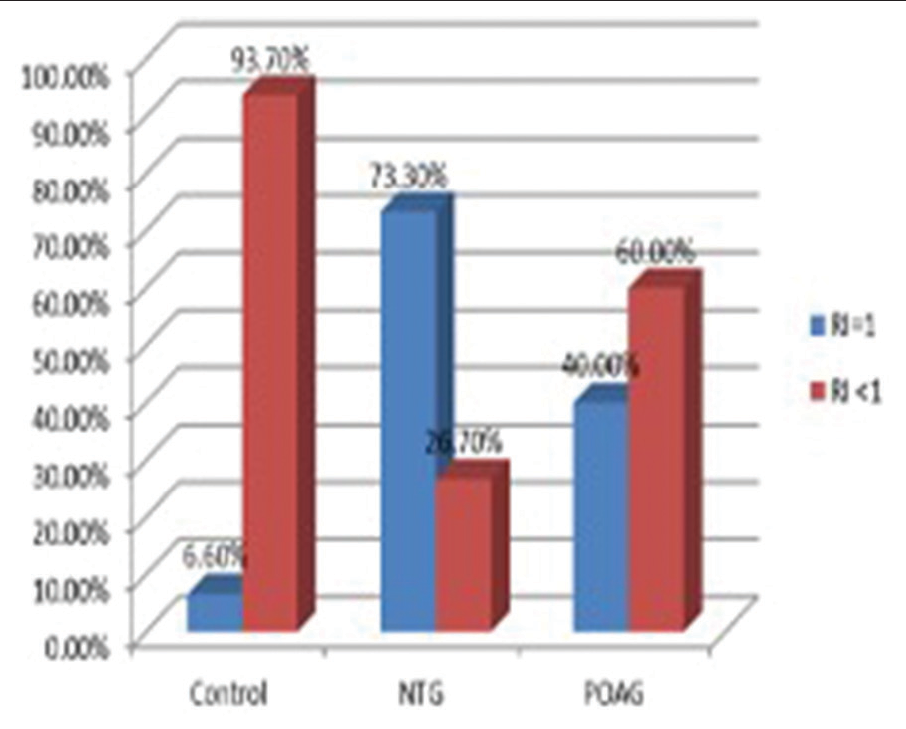
- Graph showing the percentage of patients having resistive index (RI)=1 in a central retinal artery (CRA). About 6.6% showed RI=1 in controls, 73.3% showed RI=1 in the normal-tension glaucoma group, and 40% showed RI=1 in the primary open-angle glaucoma group in the CRA. Since RI=1, end-diastolic velocity was found to be zero in these cases which indicates significant stenosis of CRA. RI: Resistive index, NTG: Normal tension glaucoma, POAG: Primary open angle glaucoma.
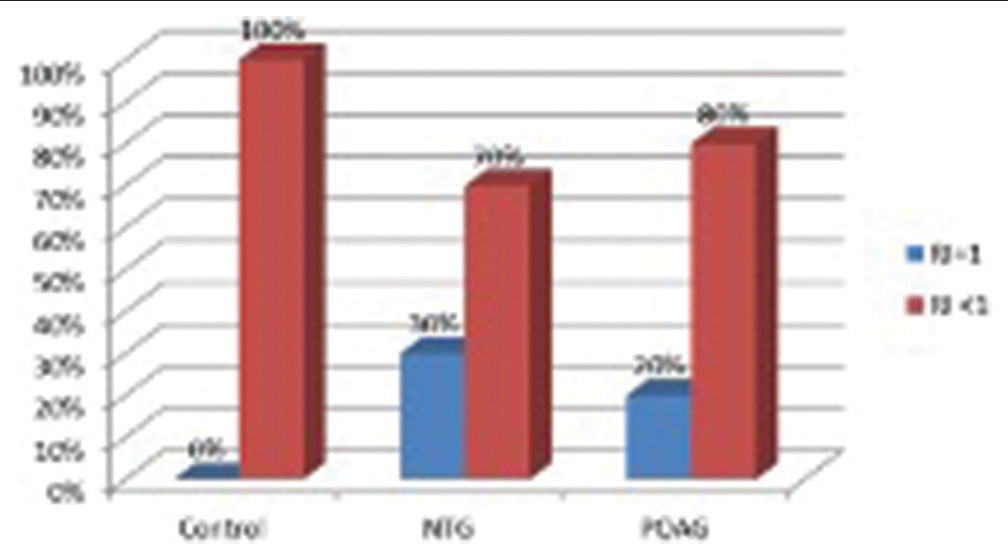
- Graph showing percentage having resistive index (RI)=1 in the posterior ciliary artery (PCA). About 30% showed RI=1 in the normal-tension glaucoma group and 20% showed RI=1 in the primary open-angle glaucoma group in PCA. Since RI=1, enddiastolic velocity was found to be zero in these cases which indicates significant stenosis of PCA. RI: Resistive index, NTG: Normal tension glaucoma, POAG: Primary open angle glaucoma.
| RI | Control Mean±SD |
NTG Mean±SD |
POAG Mean±SD |
|---|---|---|---|
| RI-CRA | 0.69±0.12 | 0.89±0.19 | 0.85±0.15 |
| RI-PCA | 0.61±0.10 | 0.73±0.19 | 0.72±0.18 |
| RI-OA | 0.70±0.07 | 0.75±0.062 | 0.74±0.069 |
NTG: Normal-tension glaucoma, POAG: Primary open-angle glaucoma, OA: Ophthalmic artery, CRA: Central retinal artery, PCA: Posterior ciliary artery, RI: Resistive index, SD: Standard deviation,
RI of OA was compared with SBP, DBP, mean ocular perfusion pressure (MOPP)*, MOPP fluctuation (difference between the highest MOPP and the lowest MOPP values calculated over the 24 h period), RNFL thickness on SD-OCT, and 30-2VFA.
*MOPP = 2/3 × MAP-IOP; MAP=DBP+ (1/3[SBP-DBP]) {MAP: Mean arterial pressure, SBP: Systolic blood pressure, DBP: Diastolic blood pressure}
In NTG, there was a positive correlation between RI-OA and SBP, and MOPP fluctuation. There was a negative correlation between RI-OA and DBP, MOPP, RNFL thickness on SDOCT, and 30-2 VFA (Mean Deviation).
In POAG, there was a negative relationship between RI-OA and SBP, and DBP. There was a positive relationship between RI-OA and MOPP, MOPP fluctuation, RNFL thickness SDOCT, and 30-2 VFA [Table 2].
| R value (NTG) | R value (POAG) | |
|---|---|---|
| RI-OA versus SBP | 0.100 | −0.259 |
| RI-OA versus DBP | −0.221 | −0.89 |
| RI-OA versus MOPP | −0.33 | 0.139 |
| RI-OA versus MOPP Fluctuation | 0.250 | 0.359 |
| RI-OA versus RNFL thickness on SD-OCT | −0.256 | 0.232 |
| RI-OA versus 30-2 VFA (MD) | −0.069 | 0.453 |
NTG: Normal-tension glaucoma, POAG: Primary open-angle glaucoma, RI: Resistive index, OA: Ophthalmic artery, MOPP: Mean ocular perfusion pressure, RNFL: Retinal nerve fiber layer, SD-OCT: Spectral domain optical coherence tomography, MD: Mean deviation, SBP: Systolic blood pressure, DBP: Diastolic blood pressure, VFA: Visual field analyzer
DISCUSSION
Hayreh,[7] stated that the posterior ciliary circulation is the primary source of blood flow to the optic nerve head (ONH). In glaucoma, CDI of PCA would be the greatest way to demonstrate ONH vascular impairment. Because there are many arteries in each subject, the measurements of these arteries exhibit greater variability.
CDI of OA has the advantage that the results are reproducible.[8] In terms of OBF, it is the most important artery. As a result, a high RI in this artery would have far-reaching consequences for the entire ocular system’s blood supply.
In the middle of the optic nerve, CRA, and its vein are in close proximity. As a result, it is impossible to precisely identify and estimate CRA velocity. Furthermore, only 10% of OBF is accounted for by CRA.
Reliability and reproducibility are best for OA.[7]
The Doppler angle affects both PSV and EDV. Since the operator’s angle is irrelevant, they are operator-dependent, but the RI ratio (angle independent) is considered a good tool for quantifying vascular resistance[9] (This is the reason for choosing OA over CRA and PCA but calculations were done for all three arteries).
High resistive index values are a sign of increased vascular resistance, which is the main cause of decreased blood flow. Organic or functional alterations in the vascular system are to blame for an increase in vascular resistance. The decreased end-diastolic blood flow velocity was a major contributor to the increased vascular resistance.
Our discussion of OBF with various parameters has so used RI-OA as the norm.
SBP and RI-OA had a positive connection in NTG, indicating that blood flow decreases when SBP rises. It could be due to (1) systemic arterial hypertension increases perfusion of the ciliary body, resulting in increased aqueous production and higher IOP,[10,11] leading to decreased perfusion to the optic disc from sclerotic arterioles[9] and (2) aggressive treatment of systemic arterial hypertension with antihypertensive causing systemic hypotension leading to a reduction in perfusion of the optic nerve.[12]
No such similar relationship could be derived from RI-OA and SBP in POAG.
Both NTG and POAG groups had a negative connection between DBP and RI-OA, which means that when DBP falls, RI-OA increases, that is, OBF decreases. Low diastolic pressure was found to be a risk factor for open-angle glaucoma in eye investigations conducted in Baltimore and Barbados.[13,14]
There was a very weak negative correlation between MOPP and RI-OA in the NTG group which implies that there was a decrease in MOPP as OBF decreases. The possible reason could be: (1) Due to reduction in nutrient supply to retinal ganglion cells leading to ONH ischemia[15] and (2) abnormal autoregulation.[16]
Lower ocular perfusion pressure was associated with an increased risk of open-angle glaucoma which was established by the Barbados eye study.[14]
No such similar relationship could be derived from RI-OA and MOPP in POAG.
In the NTG and POAG groups, there was a substantial positive association between MOPP fluctuation and RIOA, indicating that MOPP fluctuation increased as OBF decreased. The fluctuation in the NTG group may be related to a failure in autoregulation,[17] which supports the potential vascular explanation.
As the OBF drops, the thickness of the retinal nerve fibers reduces as well, according to the association between RI-OA and SD-OCT measurements in NTG. (1) There is a reduced metabolic requirement as a result of the loss of brain tissue. As a result, retinal ganglion cells require fewer capillaries for nutrition. The thinner RNFLs indicate a reduction in blood flow[4] and (2) defective autoregulation[17]
Reductions in retrobulbar and retinal blood flow over time were associated with structural glaucomatous progression, as indicated by retinal and optic nerve changes established by Tobe et al.[4]
SD-OCT measurements of RI-OA and RNFL thickness in POAG did not reveal any association.
Early visual field abnormalities were seen in 60% of NTG cases; 33.3% had normal RI-OA (0.7) and the remainder 66.6% had abnormal RI. In the remaining 40% of cases, 16.6% of patients had normal RI-OA while the remaining 83.3% had aberrant RI. However, the association between 30 and 2 VFA and the RI-OA in NTG shows that blood flow velocity decreased in individuals with field alterations, but it is not statistically significant. The severity of the visual field defect was exacerbated as RI (reduced blood flow) increased.
The limitation of our study was the small sample size.
CONCLUSION
The role of OBF measurement is more significant in NTG compared to POAG as shown by our study.
There was a weak relationship between OBF and structural and functional damage in glaucoma (NTG) showing that reduced blood flow in glaucoma appears to be neither a major consequence nor a strong cause of neural tissue loss (due to a small study group).
Declaration of patient consent
The authors certify that they have obtained all appropriate patient consent.
Conflicts of interest
There are no conflicts of interest.
Use of artificial intelligence (AI)-assisted technology for manuscript preparation
The author(s) confirms that there was no use of Artificial Intelligence (AI)-Assisted Technology for assisting in the writing or editing of the manuscript and no images were manipulated using AI.
Financial support and sponsorship
Nil.
References
- The ocular hypertension treatment study: Baseline factors that predict the onset of primary open-angle glaucoma. Arch Ophthalmol. 2002;120:714-20.
- [CrossRef] [PubMed] [Google Scholar]
- Use of colour Doppler imaging in ocular blood flow research. Acta Ophthalmol. 2011;89:e609-30.
- [CrossRef] [PubMed] [Google Scholar]
- The role of retrobulbar and retinal circulation on optic nerve head and retinal nerve fibre layer structure in patients with open-angle glaucoma over an 18-month period. Br J Ophthalmol. 2015;99:609-12.
- [CrossRef] [PubMed] [Google Scholar]
- Color Doppler ultrasound of orbital and optic nerve blood flow: Effects of posture and timolol 0.5%. Invest Ophthalmol Vis Sci. 1992;33:604-10.
- [Google Scholar]
- Colour Doppler velocimetry of the arterial vasculature of the optic nerve head and orbit. Eye (Lond). 1993;7:74-9.
- [CrossRef] [PubMed] [Google Scholar]
- Correlation of measurements from doppler ultrasound and optical coherence tomography in glaucoma. J Ultrasound Med. 2022;41:1405-13.
- [CrossRef] [PubMed] [Google Scholar]
- Blood supply of the optic nerve head and its role in optic atrophy, glaucoma, and oedema of the optic disc. Br J Ophthalmol. 1969;53:721-48.
- [CrossRef] [PubMed] [Google Scholar]
- Test/Retest reproducibility of color Doppler imaging assessment of blood flow velocity in orbital vessels. Ophthalmic Lit. 1996;3:230.
- [Google Scholar]
- Retinal hemodynamics using scanning laser ophthalmoscopy and hemorheology in chronic open-angle glaucoma. Ophthalmology. 1993;100:1561-6.
- [CrossRef] [PubMed] [Google Scholar]
- A new approach to stratified normal intraocular pressure in a general population. Am J Ophthalmol. 1986;101:714-21.
- [CrossRef] [PubMed] [Google Scholar]
- Intraocular pressure and systemic blood pressure in the elderly. Br J Ophthalmol. 1975;59:717-20.
- [CrossRef] [PubMed] [Google Scholar]
- Nocturnal hypotension: Role in glaucoma progression. Surv Ophthalmol. 1999;43(Suppl 1):S10-6.
- [CrossRef] [PubMed] [Google Scholar]
- Hypertension, perfusion pressure, and primary open-angle glaucoma. Arch Ophthalmol. 1995;113:216-21.
- [CrossRef] [PubMed] [Google Scholar]
- Incident open-angle glaucoma and blood pressure. Arch Ophthalmol. 2002;120:954-9.
- [CrossRef] [PubMed] [Google Scholar]
- A biomechanical paradigm for axonal insult within the optic nerve head in aging and glaucoma. Exp Eye Res. 2011;93:120-32.
- [CrossRef] [PubMed] [Google Scholar]
- The complex interaction between ocular perfusion pressure and ocular blood flow-relevance for glaucoma. Exp Eye Res. 2011;93:141-55.
- [CrossRef] [PubMed] [Google Scholar]
- Glaucomatous optic neuropathy: A reperfusion injury. Klin Monbl Augenheilkd. 2001;218:290-1.
- [CrossRef] [PubMed] [Google Scholar]